Monster Energy
Energy Drink
THE CONTEXT :
Monster Energy is an industry leader and one of the top providers of energy drinks in the world. The company produces a wide variety of energy drinks that are used by athletes, musicians and fans in multiple industries such as Sports, Music and overall Entertainment.
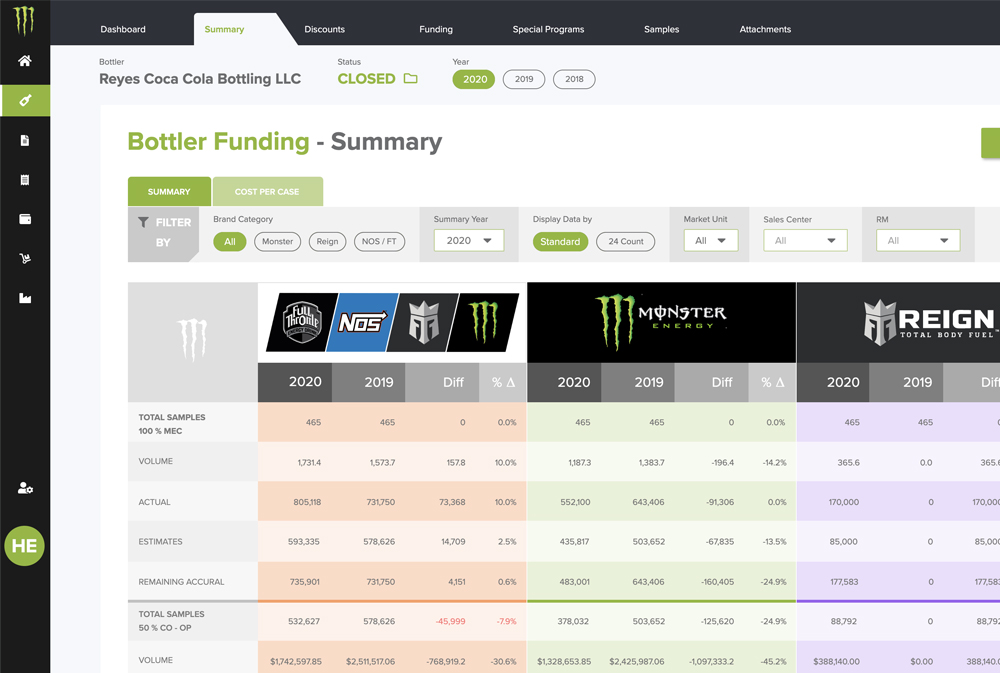
The company requested an application that would replace multiple processes for Account Managers which heavily relied on traditional documents ( Excel ) and
heavy sets of data. Their original process was extremely time consuming and required a solution that could provide automation and a single source for interactions.
- ClientMonster Energy
- IndustryEnergy Drinks
- My RoleLead Senior Product Designer ( UX & UI ) &
Front-End Developer - Websitewww.monsterenergy.com
the challenges
- Create a product that simplifies the way Account Managers interact.
- Provide a scalable foundation and design that anticipates feature growth.
- The client's vision required a product that promoted user engagement and brand empowerment.
- The company wants a model product that could be adopted for other processes.
- Create an experience in which the use of imagery is minimal without overwhelming the visitor with too much type.
- The client stressed their need for process consolidation and intuitive user flows.
the strategy
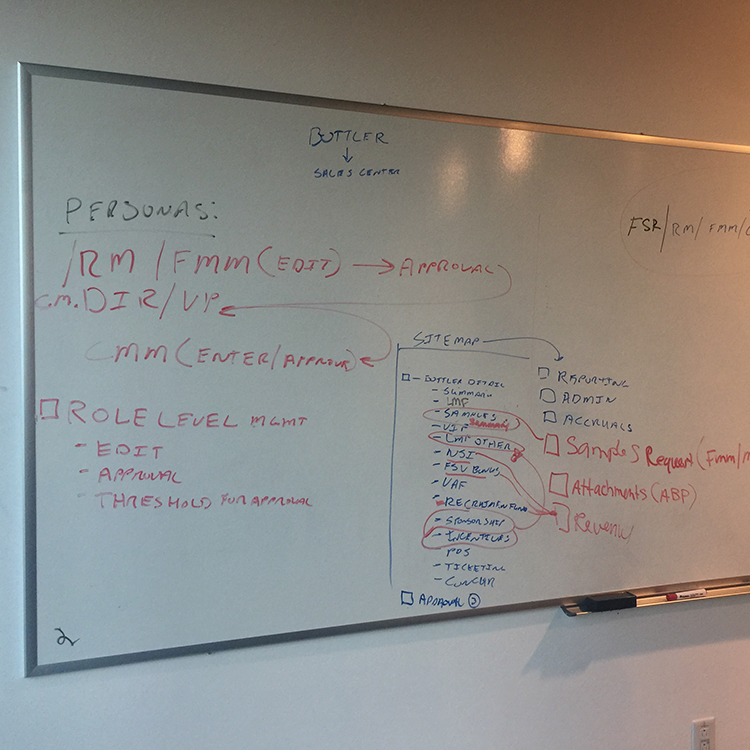
- Conduct a series of one on one interviews to collect qualitative amd quantitative data.
- Generate personas and user journey mapping based on users' provided info.
- Follow the brand's parameters according to the provided style guide.
- Promote branding within the product to enhance readability.
- Create a multi-layered structure for navigation and multiple menus without decreasing visibility.
- Maintain consistency throughout the application and establish mental models.
- the tools

MY
PROCESS
The entire process was structured to maintain the product in constant evolution by testing the design with the user throughout the iterations. This allowed the team to build an MVP that targeted the main
pain points while new features were designed as the result of continuos research, wireframing and testing.
Teammates from accounting, development and marketing teams were added to the process to keep the project grounded and provide visibility.
USER
RESEARCH
Many times I have to hit up and remind the next person in line so the approval doesn't fall through the cracks...
My team and I spend at least two days every week making sure that all the data is correct, which is very time consuming!...
- A total of 25 users were interviewed in order to reach data saturation
- I learned the workflows associated with the approval processes and the interactions between pricing reps
- I confirmed the original pain points provided by the stakeholders and pinpointed additional ones like readability and status visibility
- I learned that the average time spent dealing with discount and forecasting submissions is between 48 - 72 hours
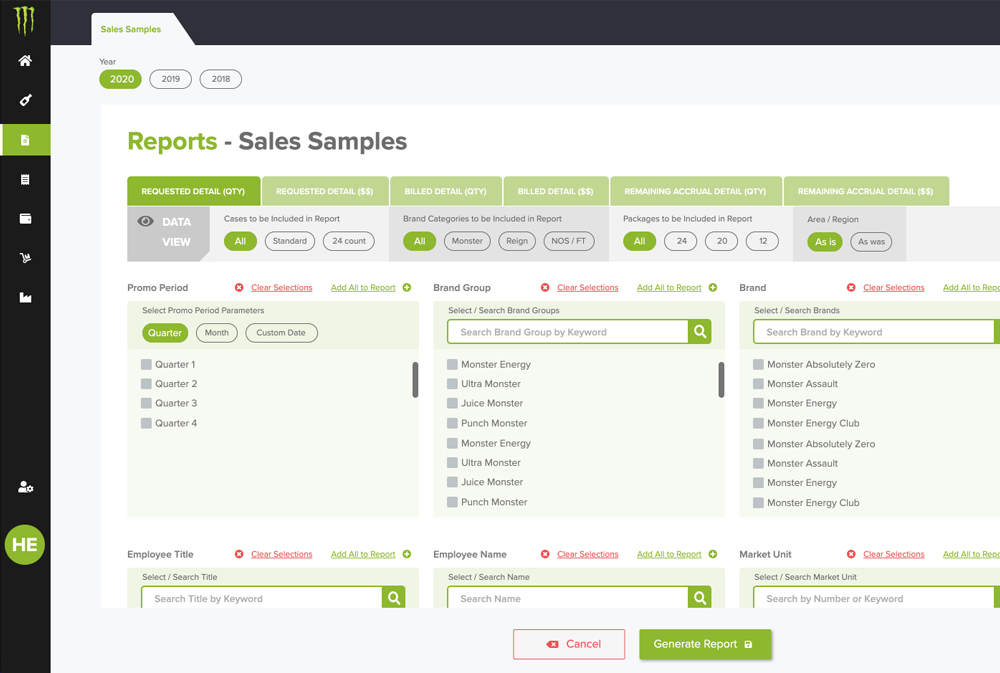
- The need of a feature that would generate custom reports was also a pattern discovered through the interviews
- A total of 150 users received the survey
- A total of 12 questions were used for each survey to ensure higher completion rates
- Both surveys were tested with pilot users before they were delivered to a bigger audience
- A screener survey was used to select users that fit the persona and increase the quality of the data collected through the main surveys
- Some of the questions used in the survey were closed and designed to measure the frustration differences between the discovered pain points. This helped me and the team generate the correct priority order for the solutions
- The open questions in the survey helped us support the future implementation of other features like "search" and "accountability modules"
- The Affinity diagramming session helped me and the team group concepts into categories that were generated during the ideation stage of the workshop
- A total of 2 Card sorting sessions were conducted to finalize the information architecture for the application
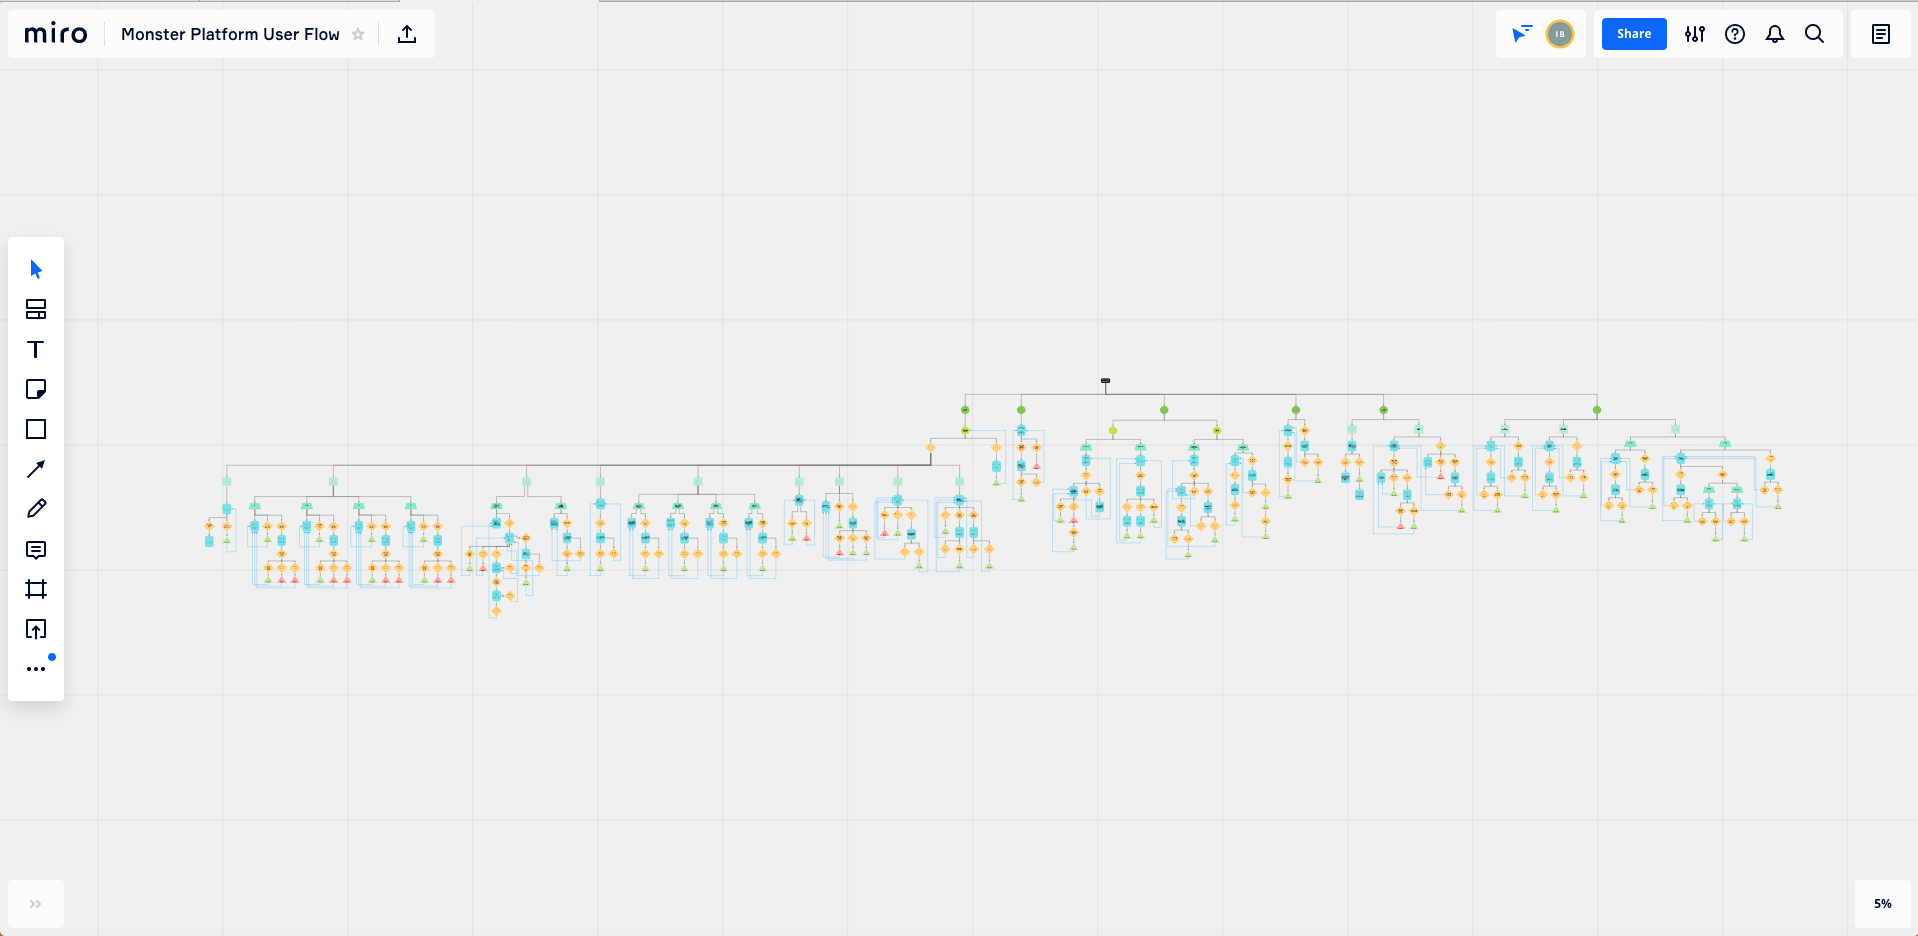
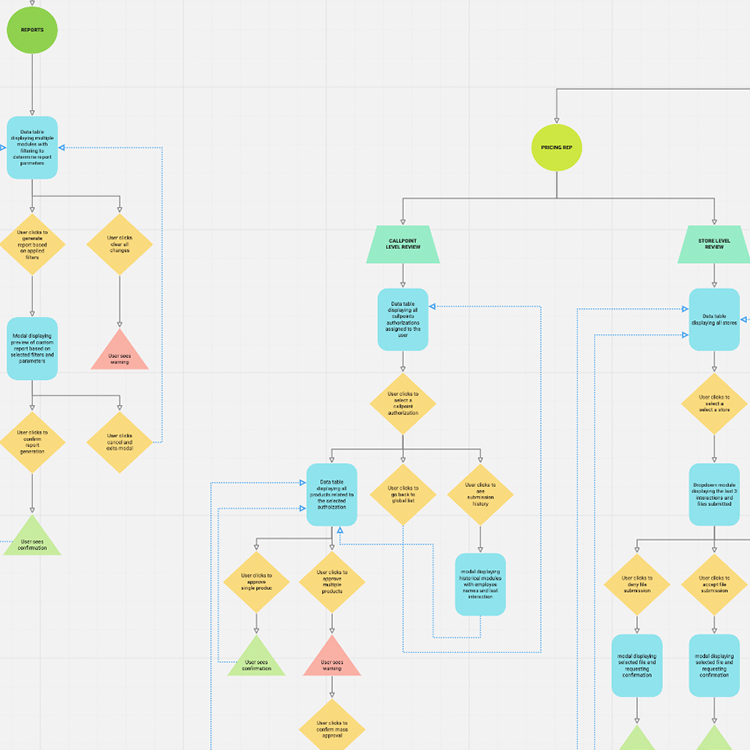
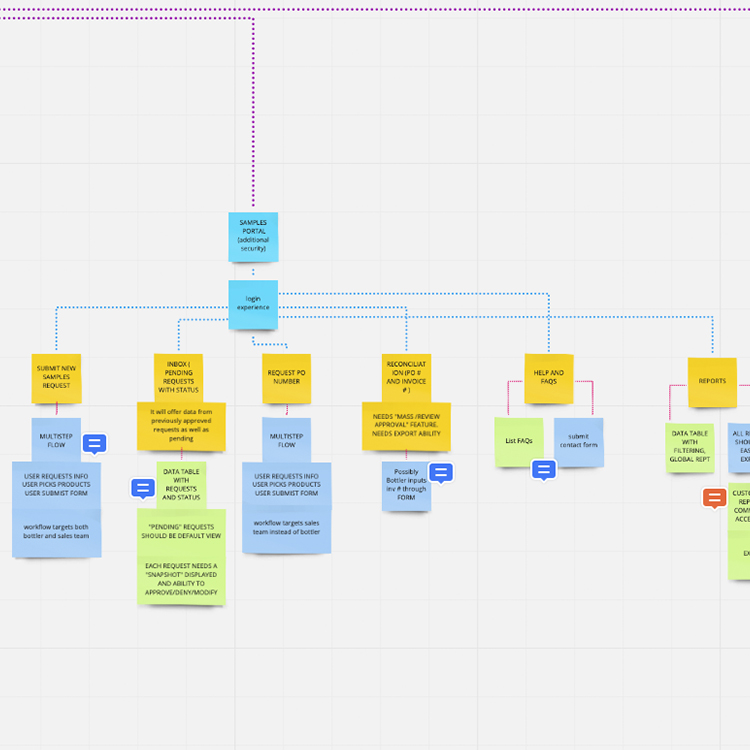
- Having a clear architecture helped me guide the mapping process for user flows. This generated a comprehensive map ( created in Miro ) that illustrated all the options and interactions a user would have while navigating the application
- Once the entire UX Flow map was created, it helped me communicate the entire process to the stakeholders so they could visualize the final product and all its functionality
ITERATIVE
PROTOTYPING
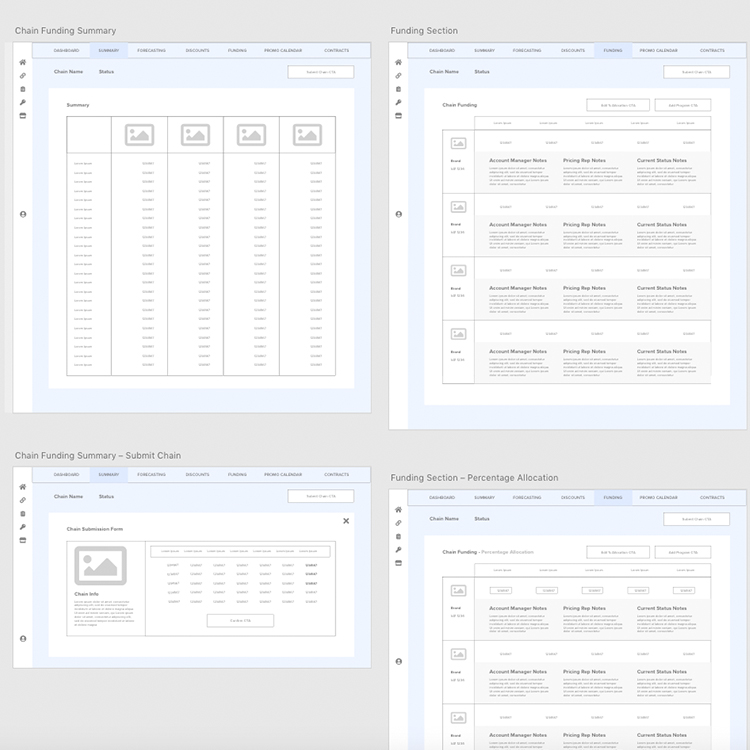
- The design created multiple versions based on the user flow map created
- Each version was meant to be considered as a possible solution that could anticipate scalability due to the data-heavy nature of the application
- As the workshop progressed, the team evaluated the top designs based on layout, visibility and the flexibility needed for an application that would continue growing. This stage of the workshop moved as an open design critique to promote further collaboration
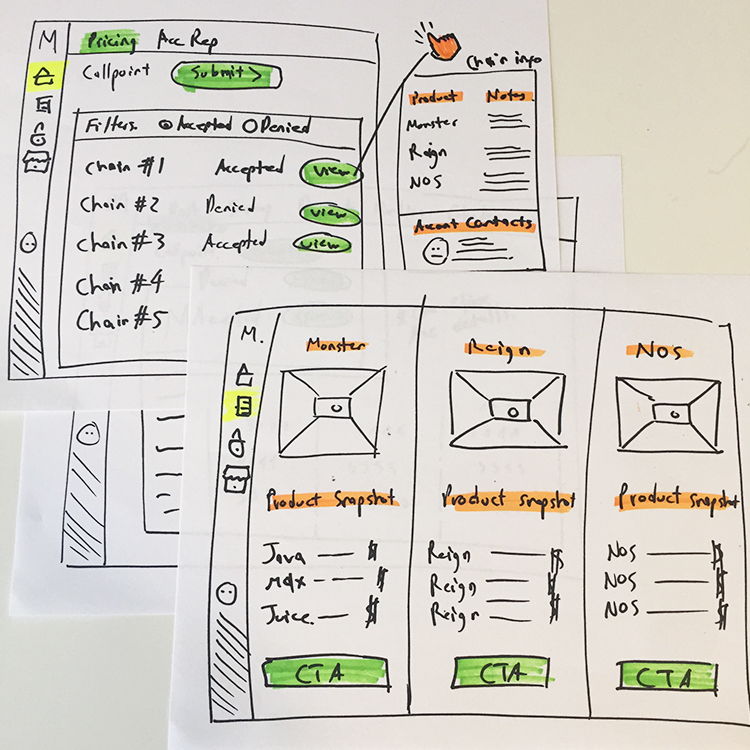
- The final version was explored deeper with additional sketches to test its viability with different user stories
- At this stage the wireframes did not require any branding or special focus on the UI.
- The prototypes focused on clearly representing the user flows and the screens for key interactions.
- Through testing workshops, we discovered that we could push inclusivity further by editing module labels to universal definitions instead of accountant-focused language.
- While the user flows proved intuitive, some of the engagement dropped when interacting with heavy sets of data.
- We realized that to increase engagement, we would have to amplify brand connection.
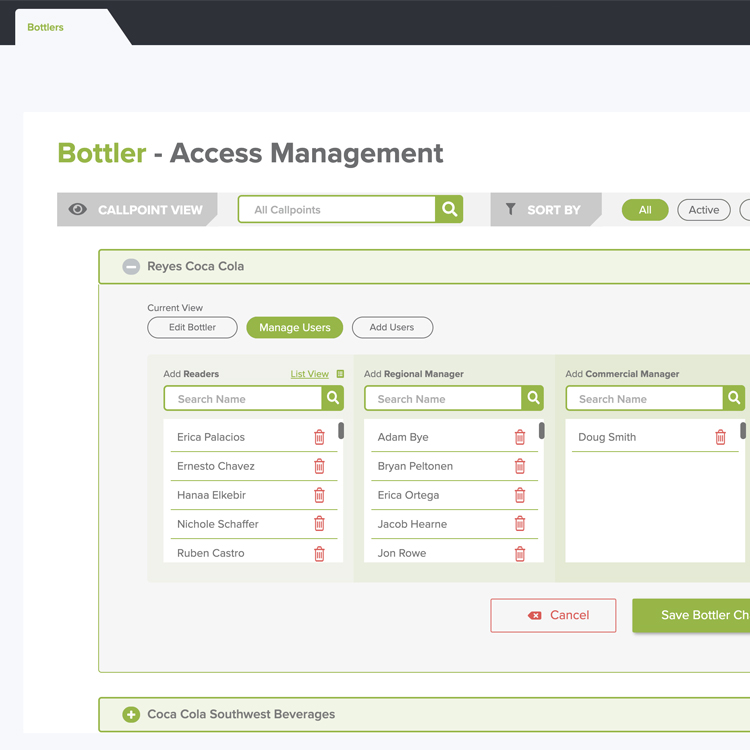
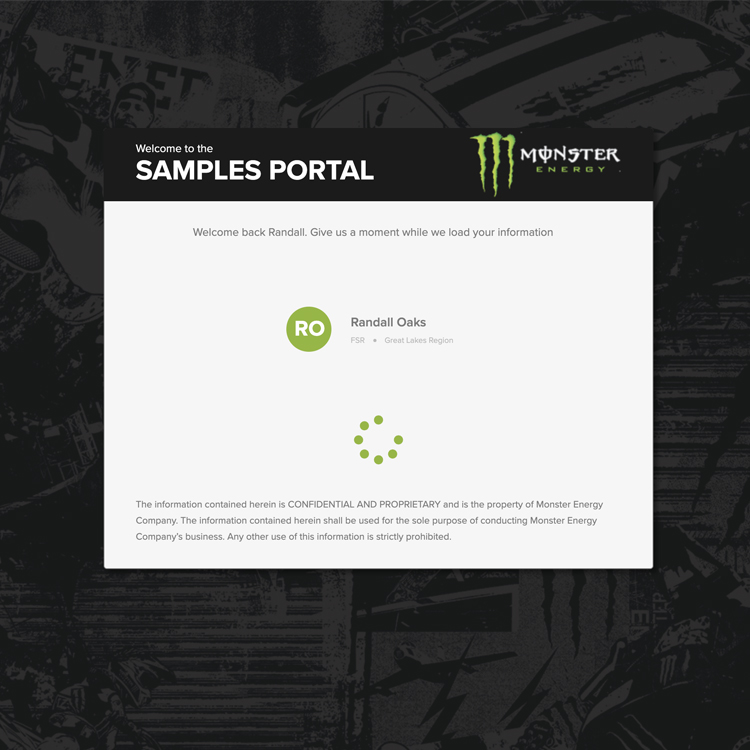
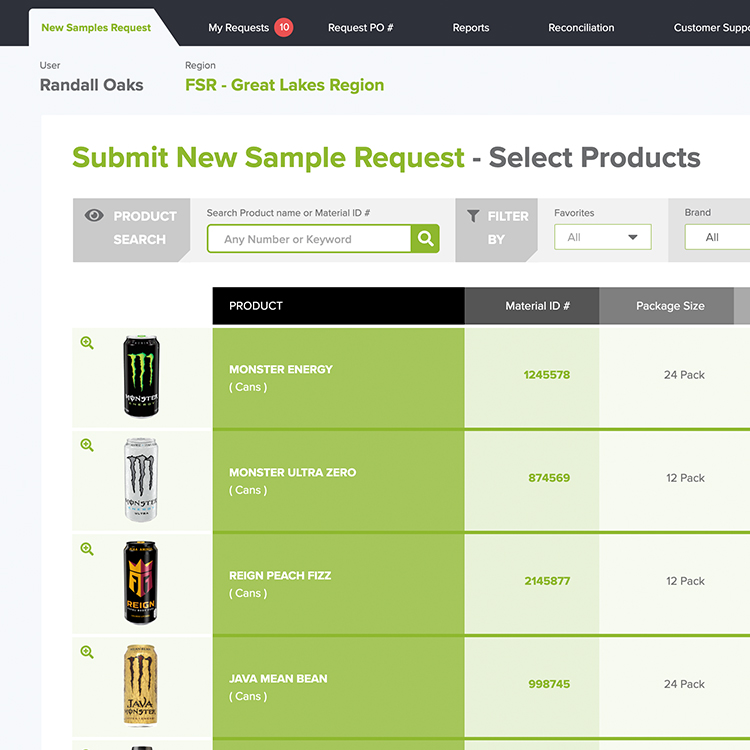
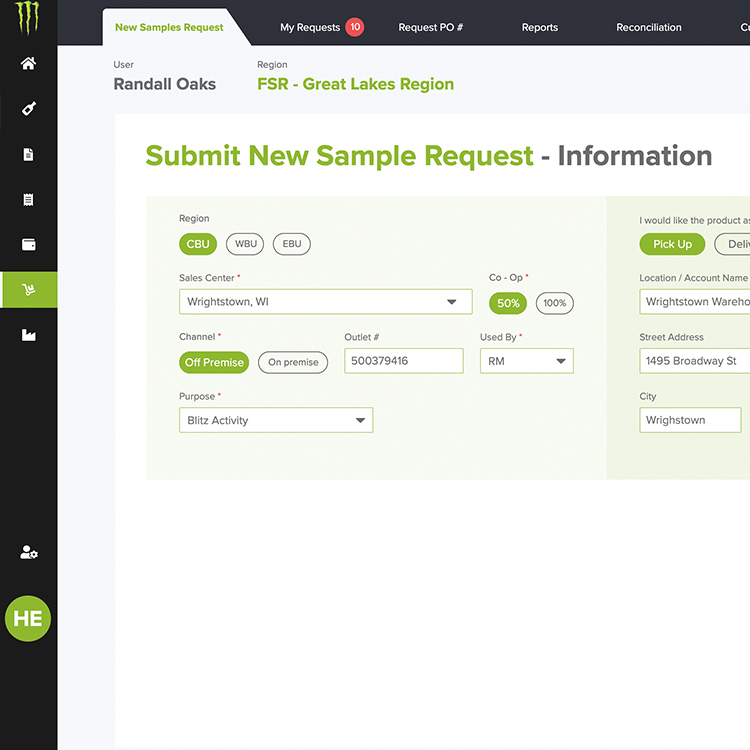
- Generate an interactive prototype that was fully branded in order to increase user connection and engagement.
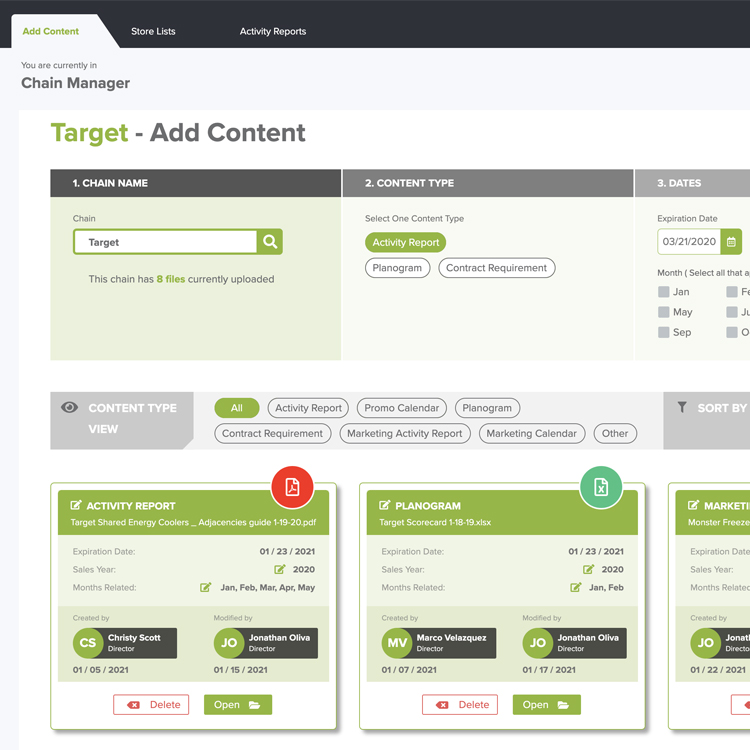
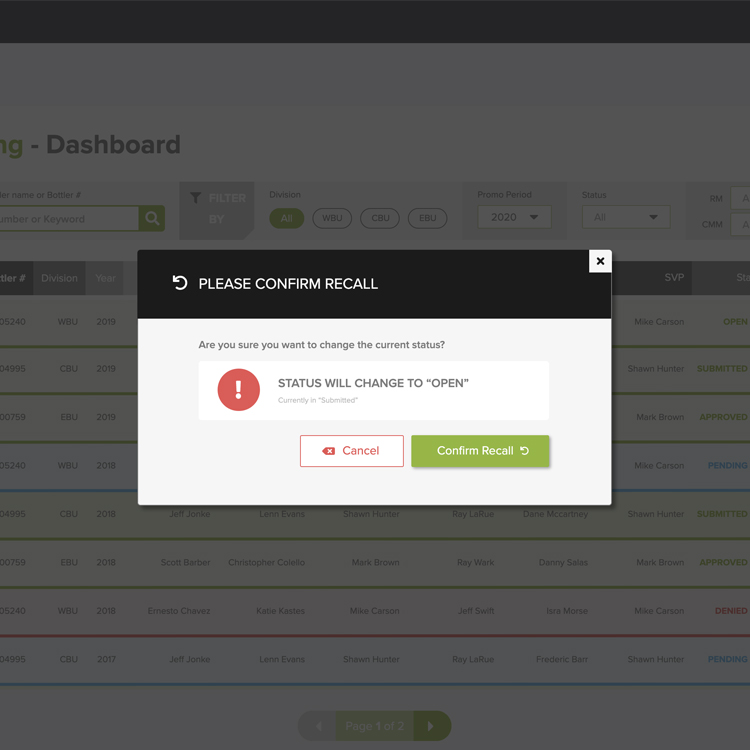
- Base the design through UI patterns that have high scalability and label display.
- Leverage the use of branded micro-interactions to create a memorable experience.
- Create a color and image-based system to support sub-branding within the platform.
FINAL
RESULT
90 days after deployment a review of the application's performance was requested to the client. The company shared the following results:
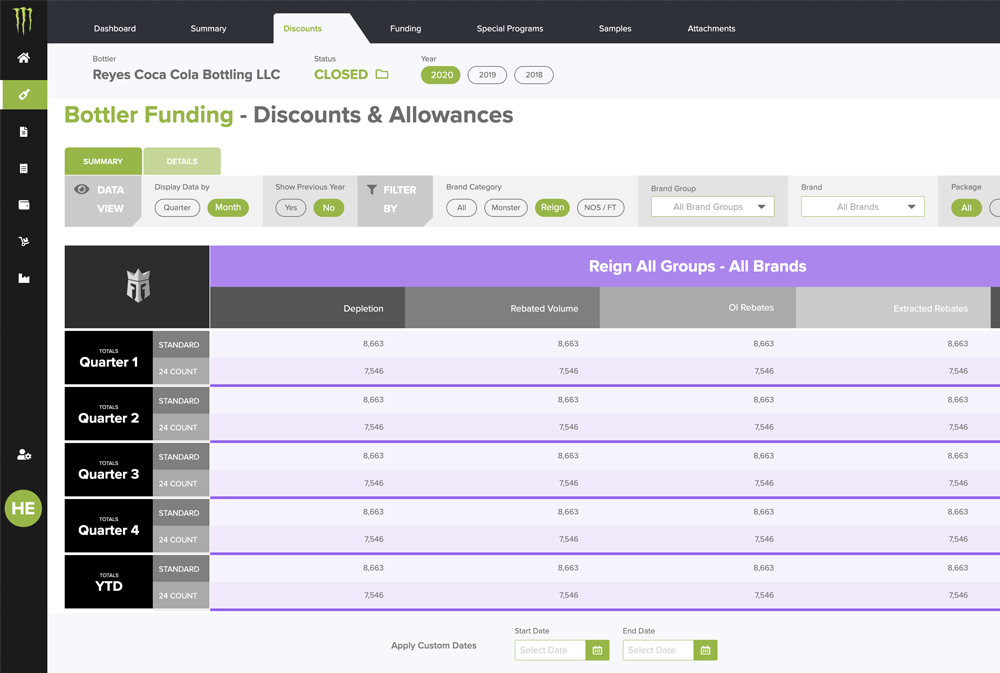
The entire design of the platform and the way sub-branding was used to simplify heavy data sets was extremelly well received. The use of atomic design methodology as the foundation, facilitated the growth of the feature set.
An unexpected positive effect that was highlighted by the company was the decrease on onboarding effort for new accounting teammates. This included users connected to manufacturing, sales and partnerships.
Thanks to the close attention to detail when applying branding to the application, the customers' engagement increased significantly. This was also evident on third party partners that required access to the platform.
Due to the high success rate of the application, the company requested the design and construction of three additional products. A forecasting tool, a record and logistics tool for drivers and a redesign for a legacy pricing tool.